Floods, Blizzards, Cold Snaps Derail the Climate Change Debate

When you are snowed in, and shivering with cold weather, it is hard to believe that the world is getting warmer.
When your house is flooded it is hard to believe that Global Warming will cause more droughts.
Yet NASA has recently released its temperature numbers for 2010, and they match the NOAA analysis, showing a tie between 2010 and 2005 for hottest year on record.
The global average surface temperature was 1.12 degrees Fahrenheit above the average for the entire 20th century. It was the 34th time running that average global temperatures have been above the 20th-century. Federal researchers claim that these figures showed that the global warming has continued. Nine of the 10 warmest years on record have occurred since the year 2000.


The NOAA report shows that 2010 was an exceptional in many ways. Globally, it was the wettest year ever. Perhaps the Australians, Pakistanis, Tennesseans and Californians who lived through epic floods would testify and agree with this.
A record heat wave in Russia lasted for more than two months, setting peak temperature records al over the country.
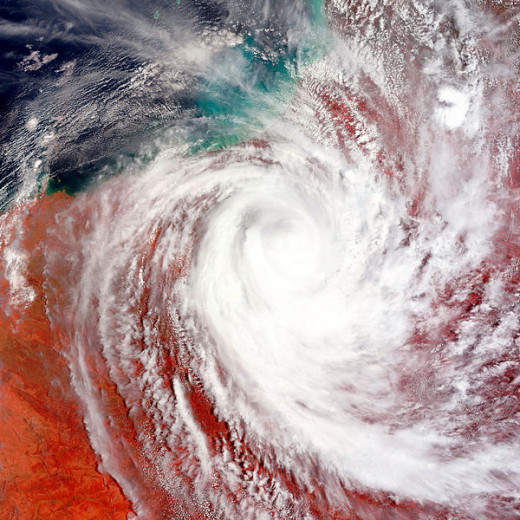
Some have argued that the floods in Queensland are the kind of extreme weather event that we can expect more of, with climate change. But these arguments are unconvincing as it appears that climate change is promoted as the universal cause of all climate events - floods, droughts, cold snaps, higher temperatues, blizzards and the increased frequency and more severe climate extremes. The Queensland flood coincided with a very significant La Nina event (explained below), and his was the mostly likely cause. Of course the La Nina itself was produced by climate change as well, wasn't it?
The climate change scientists stress these weather extremes does not mean that carbon dioxide and methane are no longer exerting a warming influence. Cold snaps, drought and floods are expected naturally even as the climate continues on a long-term warming trend.
According to Barry Hunt, at the CSIRO's Marine and Atmospheric Research unit in Australia, there still will be severe cold weather periods up to 2050, even with greenhouse warming. He maintained that the scientific basis for global warming is "very sound".
He said the basic long-term trend is for a steady global warming, over the next 100 years and Australia can expect major decreases in rainfall and a sustained long-term drying trend over most of Australia.
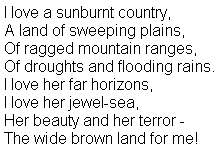
'Of Droughts and Flooding Rains'
The tragic widespread floods in Australia have starkly reminded Australians of the words of a well-known and much loved poem "My Country" by Dorothea Mackellar
Governor Arthur Phillip, three years after the colony was established in Australia in 1788, wrote the following note to the Right Honourable W. W. Grenville, the Colonial Secretary, on 4 March 1791:

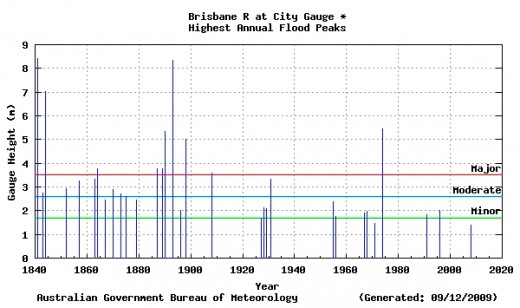
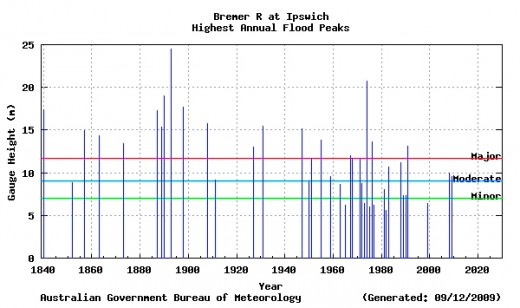
How wrong was Governor Phillip? Dry years do occur regularly, and usually accompany 'El Niño' events, as was the case in 1791. Terrible and tragic floods have occurred periodically. There have been 11 major floods at the Brisbane gauge (see image below), in the 170 years since 1840, and 19 for the Bremer River at Ipswich (see image below). The latest floods in Queensland have gone close to or exceeded the last major floods that occurred in Queensland in 1974. Floods often coincide with 'La Niña' Events. The 2010-2011 La Niña has been one of the strongest on record.
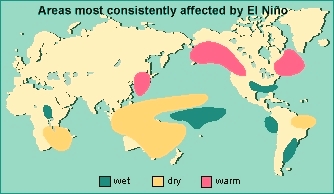
The terms 'El Niño' and 'La Niña' are explained below.
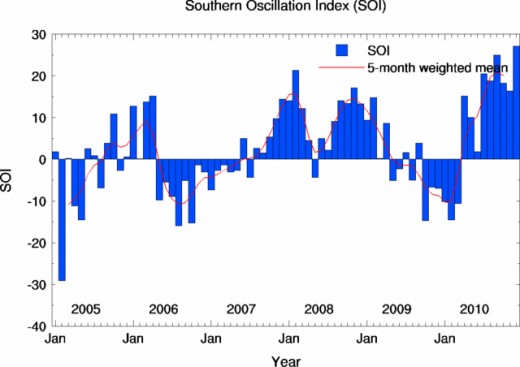
Australia's climate driver, known as the Southern Oscillation, is air pressure differences between the Asian and east Pacific regions, cause by sea temperature changes. The Southern Oscillation (strength and direction) is a simple index (the SOI), derived from air pressure difference between Tahiti and Darwin.
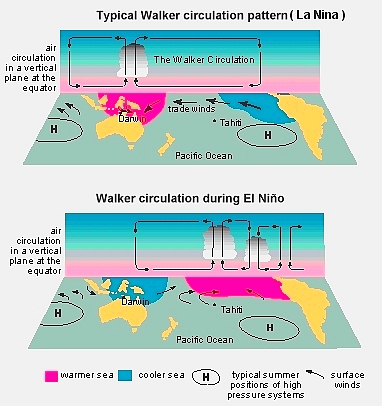
Sustained negative values of the SOI point to El Niño episodes. When the SOI goes negative it is often a sign of prolonged temperature increases in the eastern tropical and central Pacific Ocean. The strength of the Pacific Trade Winds often declines, and the net outcome is a reduction in rainfall over northern and eastern Australia.
Positive values of the SOI correspond with stronger Pacific trade winds and increased sea temperatures to the north of Australia. These episodes are popularly known as La Niña. The temperatures in the tropical eastern and central parts of the Pacific Ocean become cooler during these La Niña episodes. These two changes often are associated with increased rainfall in northern and eastern Australia as tropical moisture is fed into the air over the continent. A recent strong La Niña occurred in 1988/89. A moderate La Niña also developed slowly during 2007. A very strong La Niña developed in 2010/2011 that was associated with the widespread flooding in eastern Australia in late 2010 and early 2011.
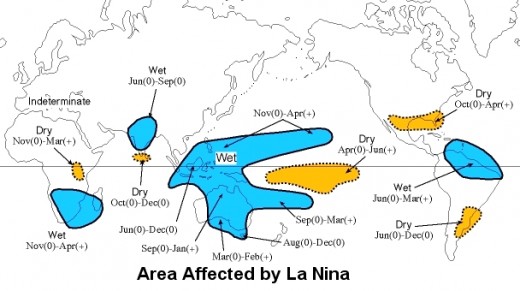
Bill Patzert, an oceanographer and climatologist at NASA’s Jet Propulsion Laboratory has reported that the 2010 La Niña is one of the strongest episodes in the past 50 years and will likely extend into the summer season in northern hemisphere summer. Climatic impacts include the record heavy rains and severe flooding in Australia and Asia. It also has produced heavy flooding in northern South America and drought conditions in Argentina.
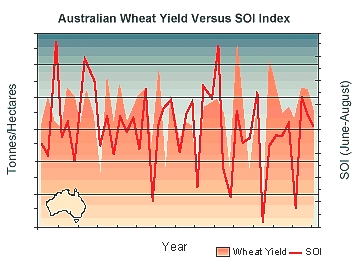
There is a strong correlation between the SOI and Australian wheat yields associated with rainfall patterns.
Floods in Brisbane
11 Major Floods have occurred in Brisbane and 19 in Ipswich over the last 170 years since 1840.
Droughts in the Murray Darling Basin - Australia
The Murray Darling Basin has exerienced 14 major episodes of drought in the last 150 years, and 34 of the 150 years have been drought years. Droughts in South Australia have occurred in the following years.
* 1884-86
* 1895-98
* 1901-03
* 1911-15
* 1927-29
* 1943-46
* 1959
* 1961
* 1967
* 1976-77
* 1982-83
* 1991-1995
* 2002–2003
* 2008-2009
The High Costs of Floods in Australia
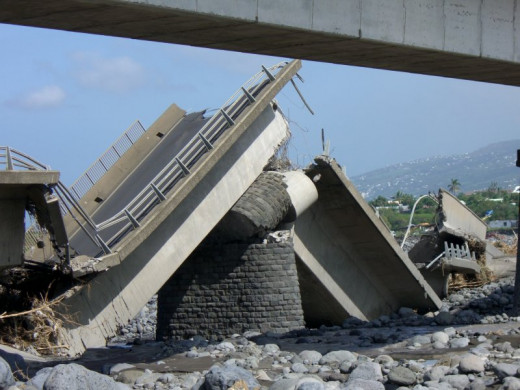
The record floods that have occurred in Australia have affected all the eastern states of Victoria, New South Wales, Tasmania and particularly Queensland. The floods have forced the evacuation of thousands of people from towns and cities. More than 70 towns and a total of over 200,000 people have been affected by the floods in an area the size of France and Germany and France combined. About 75% of the state of Queensland has been declared a disaster zone. The 2010–2011 Queensland floods have left at least 16 people dead and the toll is expected to rise wit many people still unaccounted for.
The flood damage is likely to cost the nation about $30 billion. Individual Australians are likely to bear a huge personal cost due to issues regarding their insurance cover. Consumer group 'Choice' has warned that many people had no cover or insufficient to cover the full replacement of lost homes and possessions. Many other may get a shock when their claims are rejected because of confusing definitions. The insurance companies, unlike the house owners, have very long memories of the 1974 floods.
Choice examined 45 standard insurance policies available throughout Australia and found only 13 or them (about 30 per cent) - covered riverine or inland floods caused by rivers breaking their banks. An additional 4 of the insurance policies had an option to include cover for riverine and inland floods. The remainder only covered flash and stormwater flooding (localised flooding due to very heavy rain with no rivers involved).
One major problem is that there is no standard definition for floods in the policies. This make is makes it very difficult for people to understand what they are covered for. The Insurance Council of Australia has cautioned that some households are likely to be underinsured for the type of damage caused by the natural disaster in Queensland. They have stated that not all insurance policies will cover this type of flood event.
There are three type of flooding relating to insurance:
- Most policies cover 'stormwater' flooding or 'flash' flooding only. These terms refer to very localised flooding events caused by high intensity, but short-duration rainfall events.
- Riverine flooding is caused by rivers and creeks swelling due to long duration rainfall over large catchment areas. The water originated well away from the location of the impact. This type of cover (Riverine flooding) is often not included in most policies, but can be added as an option.
- Flooding from the sea, or tidal surges is the third type of flood insurance.
Insurance policies differ greatly in terms of how they identify these types of risk. Insurance claims will be processed on a case-by-case basis taking into account the nature of the damage sustained and the terms and conditions of each insurance policy.
Is Australia's Climate Debate and Carbon Trading Scheme off the Rails?
The answer is probably Yes! - mostly because of the lack of commitment internationally. Most polls show that the majority of Australians are (or were?) in favour of doing something to reduce carbon emissions and to tackle climate change. However now the drought is well and truly over in Eastern Australia many people will fail to see the need.
A major initiative, 'The Basin Plan' to restrict extractions of water for irrigation from the various catchments throughout the Murray Darling Basin has stalled and its implementation has been delayed because of concerns at high social and economic cost by reducing extractions by about 22-29%. Most of the reductions would be achieved by the Federal Government buying back the water licence in the water market. The water would be used to meet the environmental flow requirements of the Basin.
The Murray Darling Basin is Australia's food bowl and extends through Queensland, New South Wales, Victoria and South Australia. The reduction in irrigated agricultural activity is modelled to be in the order of $800 million per year gross (which is around 13% of current gross value of irrigated agriculture production), to meet the minimal reduction of 3,000 GL per year without offsets. A fall in Basin-wide employment of around 800 full-time jobs (if 3,000 GL per year is adopted) would be expected.
But now all the dams are full and the Murray river is discharging from its mouth near Adelaide. Nature is providing the environmental flows in abundance.
The floods and full dams will definitely reduce support for action on climate change. Many people will ask: "Why pay the high cost of something that's not needed - lets control the floods".
© janderson99-HubPages
© 2011 Dr. John Anderson


